Measurement's core is a single map
Same company, same one-line question: executives scored 4.3, workers scored 2.1. How two scores that the average closed as 'fine' end up surviving as two points on a single map built from two axes and five tiers. The core design of OpenKnock Culture Ladder.

Same company, same one-line question. “At my company, you can speak up about a mistake without worrying about it later.” Executives averaged 4.3. Workers averaged 2.1. When both scores landed next to each other on the same slide, everyone in the room wore the same expression for a moment.
Take the average and you get 3.2 — and the report closes on “fine.” But the fact that two people inside the same company answered the same question with scores almost two times apart was cleanly erased by that single average. The two worlds the average hid is where this part starts.
01 · The Surprise
Where the average lies
An average of 3.5 can mean two completely different things. Everyone scoring 3.5, in lockstep — or a company split into two worlds: executives at 4.5, workers at 2.5. With only the average printed in the report, the two look like the same company. For a safety practitioner, the second one is the far more dangerous signal. When executives and workers see the same hazard in different colors, the incident starts in the gap between those colors.
Read by average, two different companies look the same. But incidents don't happen at the average — they happen at a single point in the distribution.
For an organizational-culture diagnostic to actually do work for a safety lead, this gap has to be visible. So the decision we held longest was this one: how do we split the same response so the gap survives?
02 · Two Axes
Who answered, and who the answer was about
The opening one-liner — “at my company, you can speak up about a mistake without worrying about it later” — was the same single sentence, but depending on who answered, it became an answer about a different target. When an executive answers, they're rating the atmosphere they themselves (= the leadership) create. When a worker answers, they're rating the atmosphere their leader creates. Same sentence, different landing place.
Most surveys collect responses into a single bucket. Who answered shows up only as a role label; who the response is about is never even asked. Culture Ladder pinned the same response with two metadata fields instead.
- SUBJECT — who scored it.The respondent's own classification (role · department). Executive, manager, or worker.
- EVALUATOR — who the answer is about. Executives, leaders, peers, the respondents themselves — whoever the response is rating.
With both axes in place, the same company surfaces two different landscapes.
Two people looking at the same place.On the same one-line question — “at my company, you can speak up about a mistake without worrying about it later” — executives scored 4.3, workers scored 2.1. A two-times gap. That's what the average of 3.2 was hiding. Same company, executives and workers seeing two different companies — and the incident shows up first exactly at that misalignment.
One person looking at two places.A worker answers the same question twice. “Executives take risk reports seriously” → 2.1. “Coworkers take risk reports seriously” → 4.0. Information is blocked going up but flows sideways. Risk circulates among coworkers but never reaches the top. That is exactly where a safety lead needs to put their hand first.
03 · Behaviour + Precondition
A step on the behavior, a condition beside it
Coordinates alone don't answer the question which step is this. For the SCL ladder's five rungs to really function as steps inside the scores, every behavior item had to know — at design time — which step it belonged to.
Whether “reports a hazard upward” is a step-1 behavior or a step-4 behavior has to be decided when the survey is designed.
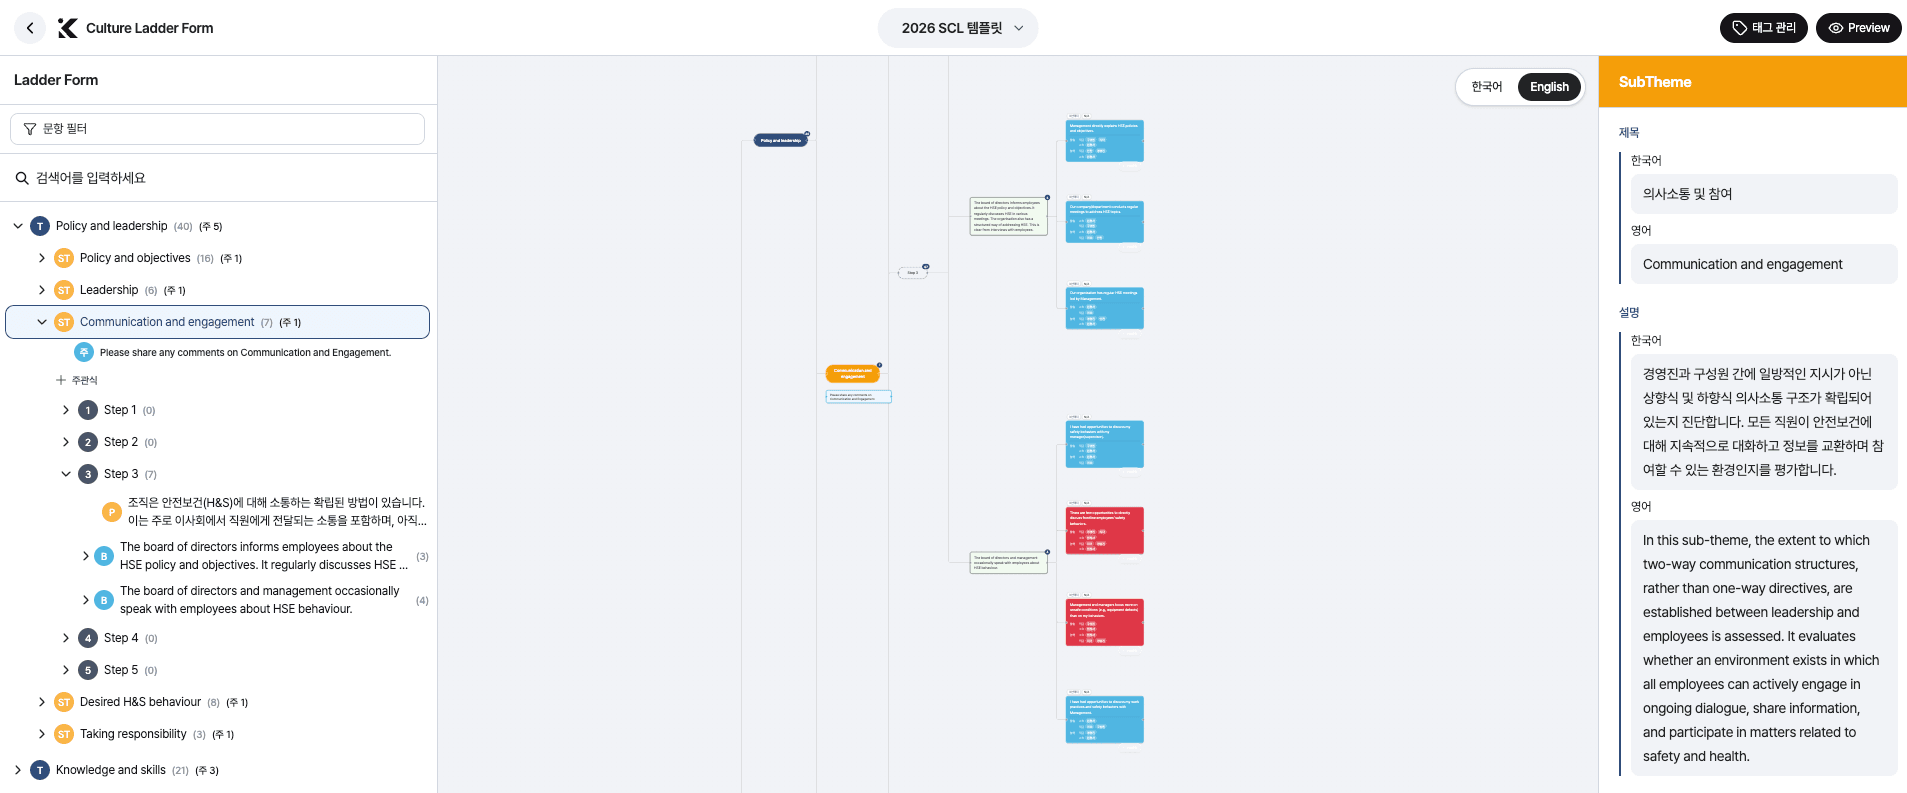
So we built the taxonomy as a five-tier tree.
- Theme — the five top-level branches. Big categories like leadership, information flow, learning, rules and standards, participation and accountability. The names of the five shift by industry and round, but the promise of cutting into five never breaks between rounds.
- SubTheme — sub-regions under each Theme.A single Theme is too wide a measurement unit on its own; cutting it once more creates the place where measurable behaviors hang. Under “information flow,” for example, a SubTheme like “risk reporting” hangs.
- Behavior — the smallest measurable unit. The leaf of the taxonomy, hanging under a SubTheme. Every Behavior carries a step_value (1–5): “never reports an incident” is step 1; “reports a hazard upward” is step 3; “the incident reporter is publicly thanked” is step 5. When the responses clear that step's threshold, the company is counted as having filled that behavior at that step.
- Precondition — the environmental condition that enables the behavior.It hangs next to the Behavior in its own column, so when the behavior isn't happening, the analyst asks about the environment before pushing the person. If reports are blocked, before pushing the reporter, you have to ask first whether reporting doesn't come back as a loss is something the company has put in place.
- Question — the one line the respondent actually sees.Behavior and Precondition each get rendered down into Questions that make up the survey itself. The Behavior's step_valuerides down with the Question, so it's baked in from the start which step of behavior the question is asking about. The respondent sees only a single line, but the source (Behavior · Precondition) and the step travel with every response, and on the dashboard the response walks back up the taxonomy.
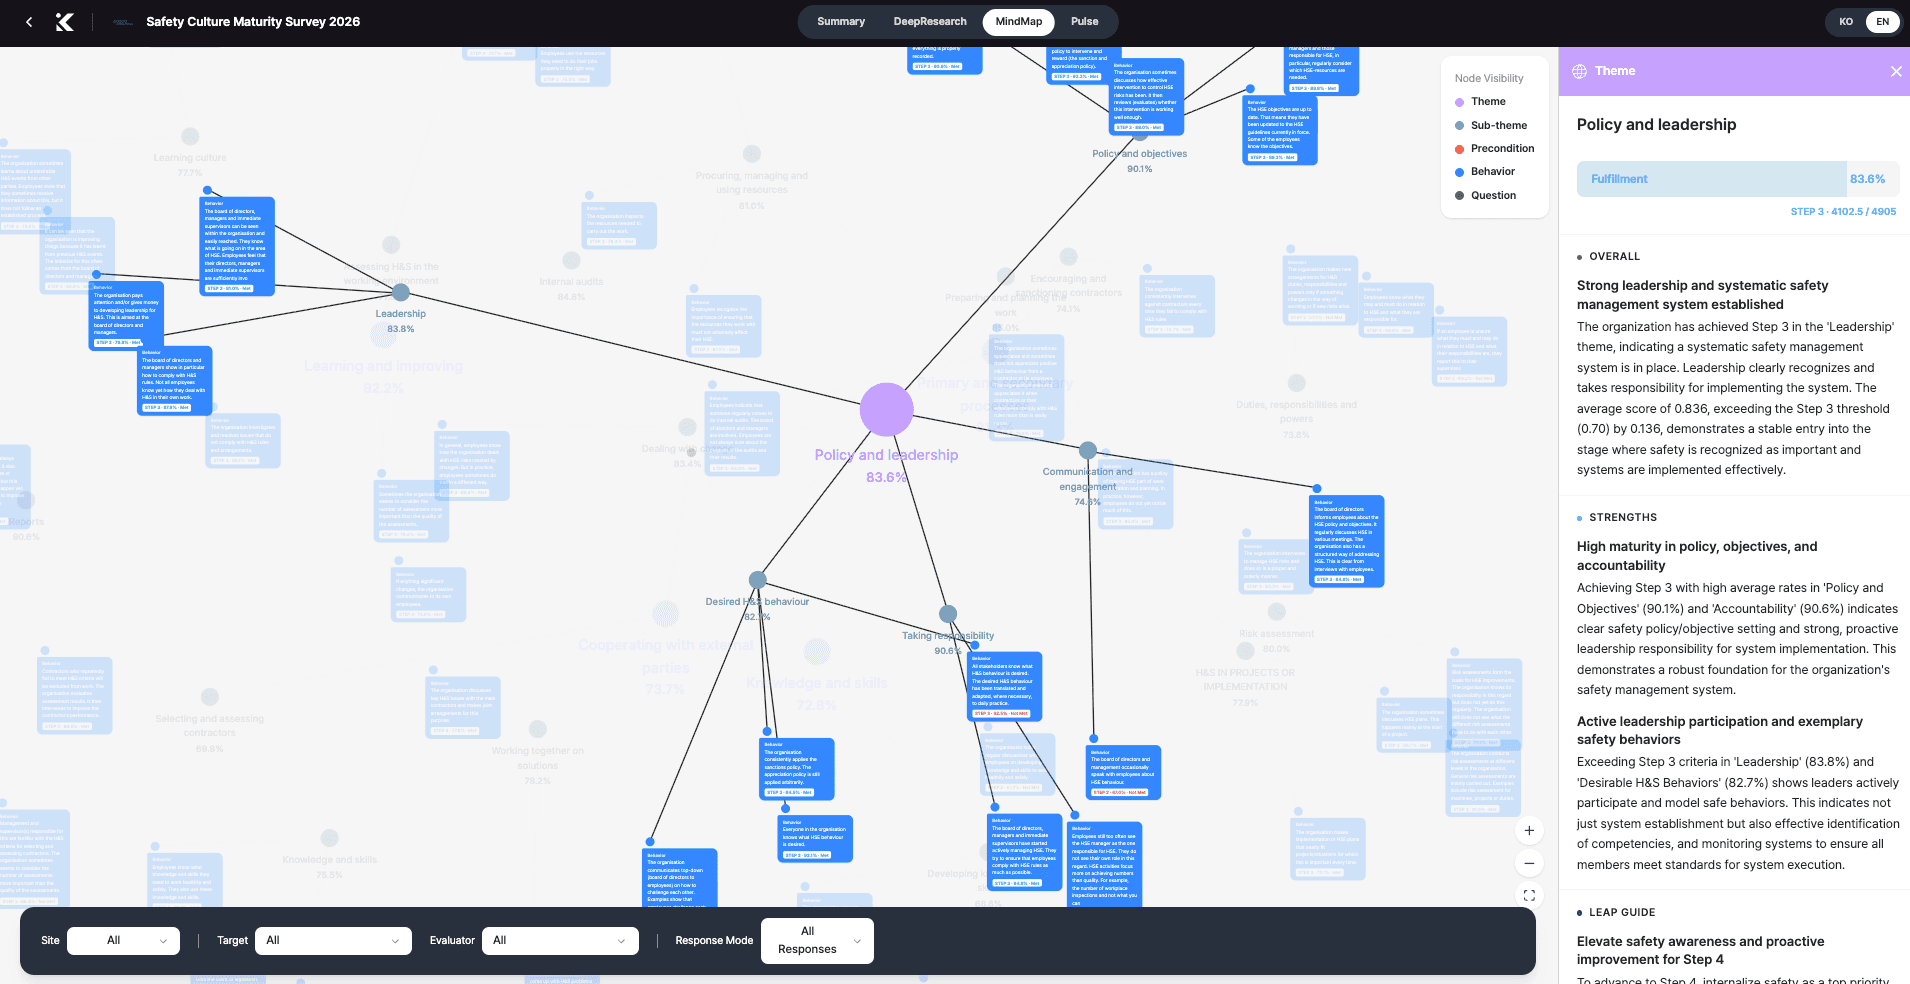
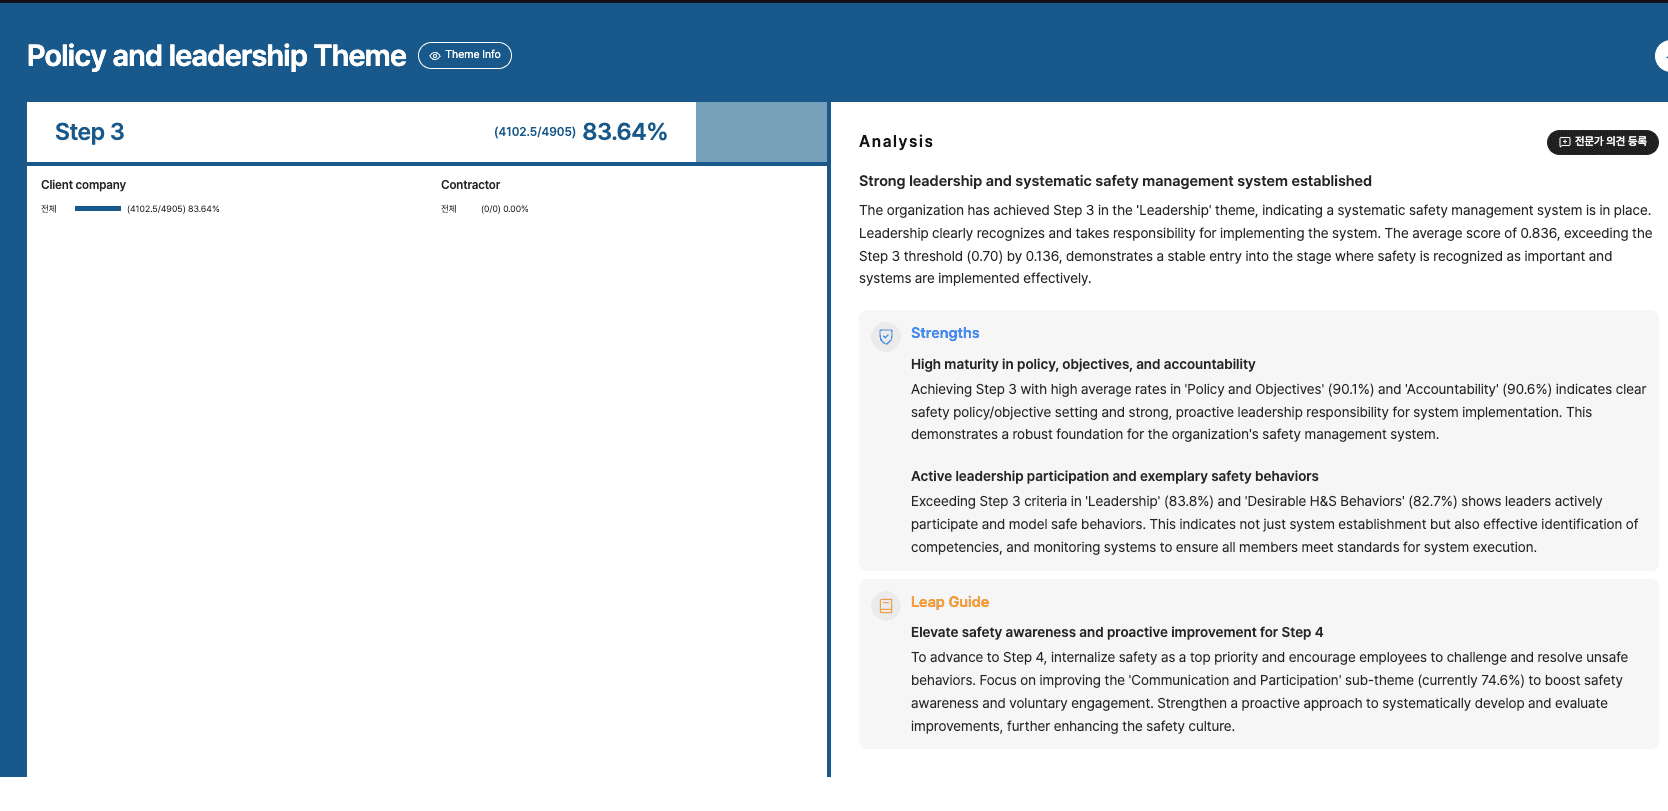
When negative responses pile up on a behavior item in the survey, the Preconditions hanging next to that behavior open automatically on the results screen. That single cell becomes the starting point of an improvement. Instead of closing the result and sending it to a PDF folder as the final motion, the results screen becomes a bridge straight into the design room of the next survey. It is the start of measurement moving into change — and the subject of the last part.
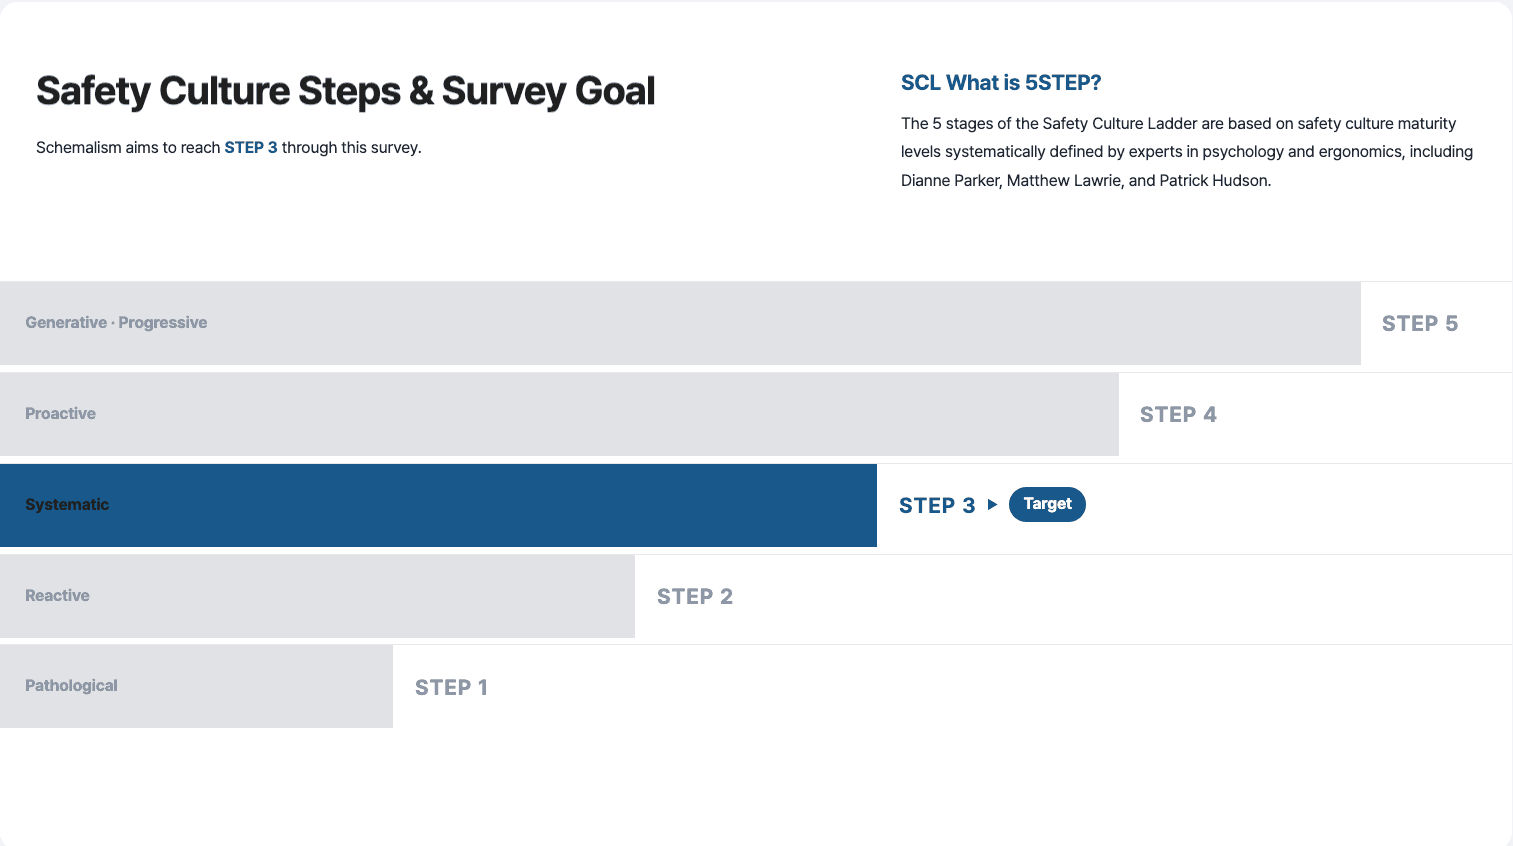
Each survey carries its own target_step. The first survey aims at STEP 3; the next aims at STEP 4. On the same survey form, only the target step moves up a notch at a time. The fact that you don't have to climb the whole ladder in one round is pinned not in the results screen, but in the data structure.
This survey's score isn't the result. It's the raw material for the next survey.
04 · Core Design
The core design of Culture Ladder
That is the core design of OpenKnock Culture Ladder. Two axes (who answered × who the answer is about) and a five-tier taxonomy (Theme → SubTheme → Behavior / Precondition → Question). Put together, they become a single map that lets a company read itself in one place. When 5,000 people in a company answer, 5,000 dots fall onto that map.
Where the dots cluster, where they leave gaps, where the distance between two dots splits two-to-one — that landscape, read in one place, is the map. The place where a report that used to close on a single average starts shifting the consensus in the meeting room into a different shape.
The map is the measurement. The number that lands on it is just the result.
But a single photo isn't enough to know where a company stands. A single photo is one moment's landscape. When several photos stack on the same map, they become one company's timeline. When companies from different industries meet on the same map, the timeline becomes a position on a distribution. The place where the map really starts doing work is the next part.
Written by

Yunhwan Jeong
Founder
Runs schemalism. Develops the business from an engineer's vantage — enjoys taking a hypothesis, validating it firsthand, and pushing it into the next bigger stage. Picks the next move every time at the seam where code meets business.
Part of this series
Can organizational culture actually be measured?
OpenKnock Culture Ladder is a survey-based diagnostic for organizational safety culture. The benchmark isn't ours. We lifted NEN SCL, the Dutch national safety-culture certification standard, and use its five-step ladder as is, asking which of the five rungs a company stands on, round after round, against the same benchmark. Built by schemalism with RIMS and LRQA, and already pinned in place on the same benchmark by Hyundai Mobis, Kumho Petrochemical, and POSCO International, ~15,000 responses in. Six essays on what we saw between measurement and change.
All parts
06